
Flashback to 1995 in the Housing Market vs Today
At 4.06 million, the annual pace of 2024’s existing-home sales was the lowest number recorded since 1995, when it was 3.85 million.
WASHINGTON — If one reminisces about 1995, one may remember their real estate office equipped with Windows 95. Fax machines were a staple in business communication, but electronic mail was slowly emerging as more common. VHS tapes were the most popular way to watch a movie, and CDs were becoming more common, replacing cassette tapes. Just 2% of home buyers looked for homes online in 1995 – compared to 100% last year.
So why the comparisons to 1995? At 4.06 million, the annual pace of 2024’s existing-home sales was the lowest number recorded since 1995, when it was 3.85 million. But, as clearly noted, the world was in a much different place. This blog post dives into the nearly 30-year comparison to see the changes and difficulties buyers faced last year.
In 1995, the population of the U.S. was 266.6 million, while in 2024, the population was 341.1 million —a difference of 74.5 million people. The reasons for the lower home sales figures are illuminated when looking at both housing inventory and affordability. In December 1995, 1.58 million single-family homes were available to purchase compared to December 2024, with just 1.00 million single-family homes. The months’ supply in 1995 was 4.8 months compared to just 3.7 months in 2024. While there has been an improvement in housing inventory since 2023, when the month’s supply was just 3.1 and the December single-family inventory was under 900,000, there is a long way to go to meet the current population demand.

The second major hurdle is housing affordability. For the median home sales price in 1995, it was $114,600 ($241,000 inflation adjusted). The median sales price in 2024 hit a new historical high of $407,500. This is good news for homeowners and potential repeat buyers as they earn housing equity — but creates difficulties for new first-time buyers. In 1995, mortgage interest rates averaged 7.93%. In 2024, mortgage interest rates averaged 6.72%.
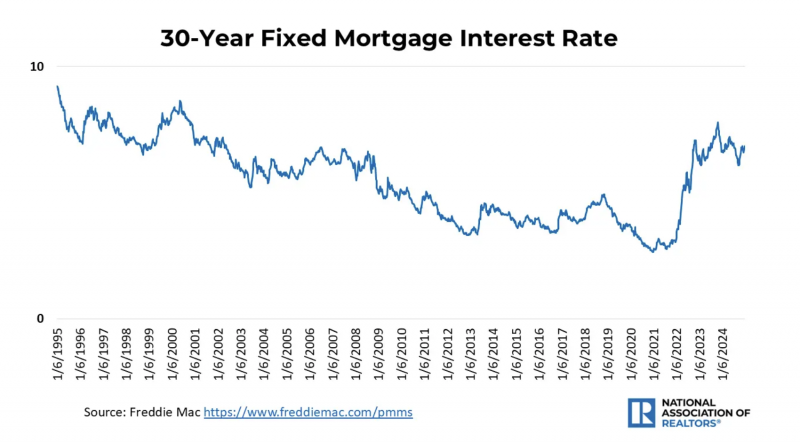
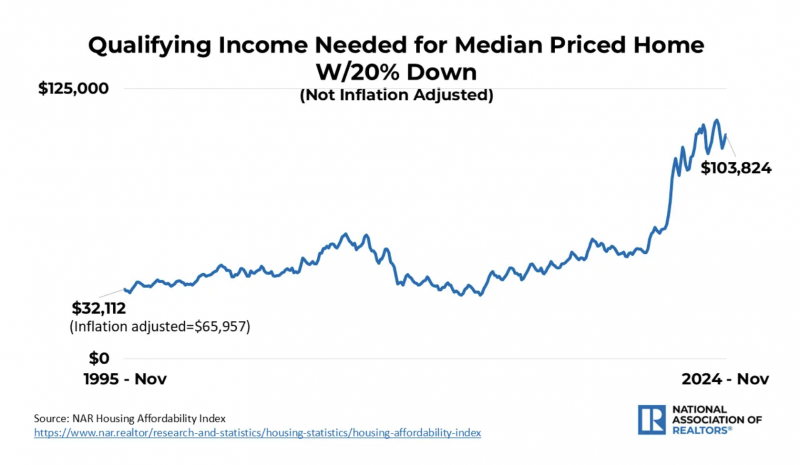
Looking at sales prices and mortgage rates is helpful in the context of overall housing affordability and how far one’s income can go when purchasing a home. To make comparisons of the latest data available, in November 1995, the NAR Housing Affordability Index was 126.9 (above 100 is more affordable), the qualifying income to purchase a home was $32,112 (the same buying power as $65,957 in November 2024), and the mortgage payment as a percent of one’s income would be 19.6%. These factors have changed dramatically with limited housing inventory and the rise in home prices. In November 2024, the housing affordability index was 99.0, the qualifying income to purchase a home was $103,824, and the mortgage payment as a percent of one’s income would be 25.2%.
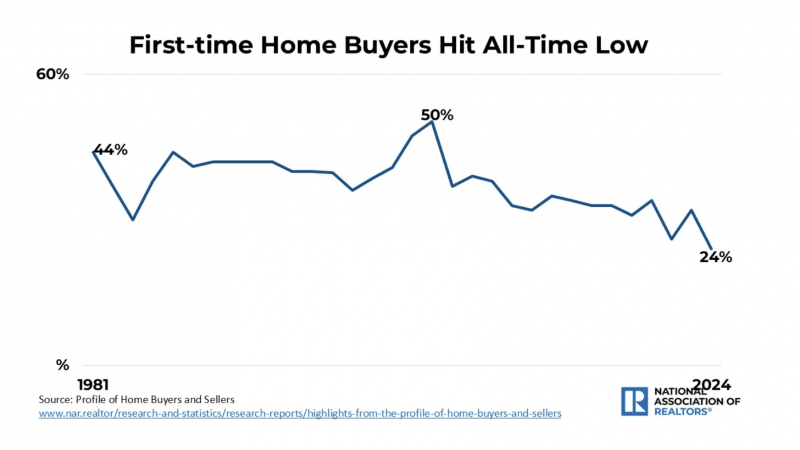
Given these measures of housing affordability and inventory, one should not be surprised that those who were able to purchase a home in 1995 are markedly different from those today. The 1995 Profile of Home Buyers and Sellers shows that 42% of home buyers were first-time buyers. In 2024, the share dropped to a historic low of 24%. First-time buyers were younger at just 31 years old compared to 38 years old today. Buyers today have to save for longer periods while paying for debt that was not as common in 1995 — i.e., student loans.
The headwinds for the 2024 housing market were severe, but 2025 is already showing signs of encouragement. Home sales activity for the end of 2024 showed rapid signs of improvement. Interest rates are lower than one year ago, and the market has added inventory.
© 2025 National Association of Realtors® (NAR)