News & Media
10 Things About the Housing Market Right Now
CoreLogic said high mortgage interest rates during the spring home season drove home sales lower, cooling home prices in more markets.
NEW YORK – Demand cooled among all types of buyers, including investors and buyers looking at newly built homes. While buyers are increasingly looking at adjustable-rate mortgages to help with surging homeownership costs, persistent imbalances between buyers and sellers in some markets continue to put pressure on home prices.
Let’s look at where the current landscape stands:
- The number of mortgages with delinquencies of six months or more fell to 2008 levels. Approximately 100,000 borrowers were six months or more past due on their mortgages, a level not seen since before the Great Financial Crisis that started in 2009. At the same time, the share of mortgages in foreclosure fell to 0.2%, which was the lowest share since early 2022, indicating that many borrowers who were in the late stages of delinquency were able to avoid foreclosure.
- The adjustable-rate mortgages (ARMs) share of originations rose to 15.5% of the dollar volume of conventional single-family mortgage originations in May 2024. This share is the highest of 2024, following a slight dip in late 2023. The increase in ARM originations followed the rise in mortgage rates. The share of ARMs declined during the pandemic and hit a 10-year low of 4% in January 2021 when 30-year, fixed-rate mortgages fell to an all-time low. However, as fixed-rate mortgage interest rates increased from below 3% to record levels over the last two years, ARMs have gained renewed interest.
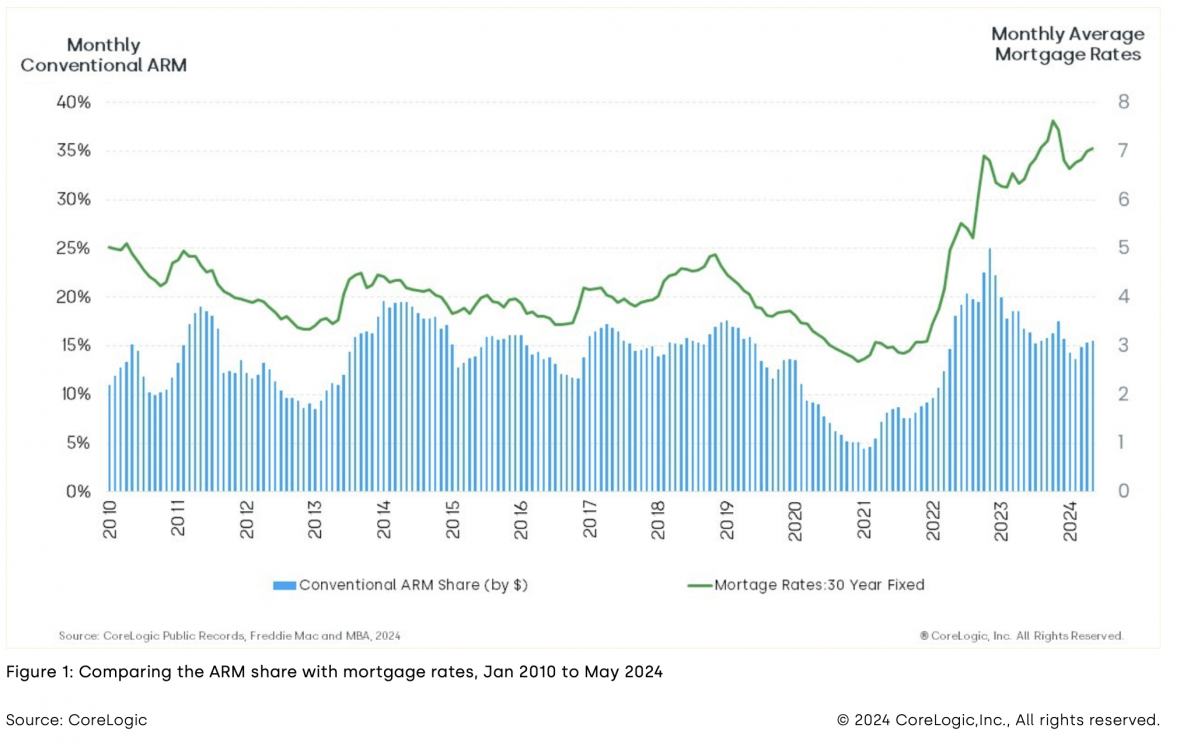
- Despite increased popularity, the ARM share of total outstanding mortgages and all outstanding conventional mortgages remains low at 5%. Following a surge in ARM originations leading up to the Great Financial Crisis, when ARMs comprised about 20% of all outstanding mortgages, the share has steadily declined to reach a low of 4% during the pandemic.
- Among all home sales in the closing process, 8.6% were appraised below the contract sales price in June, down from 10.7% a year ago. This change brings the appraisal gap back to pre-pandemic levels. Appraisal gaps are more prevalent among small starter homes than among larger, more expensive homes. For example, 9.6% of small starter homes were appraised below the pre-closing contract sale price, down from 12.1% a year ago. At the same time, 7.1% of larger, more expensive homes had an appraisal gap, down from 8.3% a year ago. This higher appraisal gap among starter homes may reflect a higher risk of overpayment by inexperienced first-time homebuyers.
- Sales of newly built homes are down 17% year over year through the first six months of 2024. Nearly all markets have seen declines. Of the top 30 U.S. metros, only Portland, Oregon and Las Vegas showed increases in newly built home sales so far this year. Both metros were up 2% year-to-date.
- Investors made 23% of all single-family home purchases in June 2024, down 5 percentage points from January 2024. This is the lowest the investor share has been in two years, but is still well above pre-pandemic levels, when the investor share averaged 17%. Investor activity also varies seasonally and tends to slow during the spring homebuying months before picking up in the latter part of the year.
- Sales of existing homes declined 19% in June compared to last year. The month ended the streak of slight annual improvements seen in months prior. While existing home sales historically have a seasonal slowdown in July, the slowdown came early this year – likely driven by surge in mortgage rates in April and May. At the same time, June pending sales ended up 9% over 2023 suggesting some potential recovery of closed sales coming.
- 34% of homes sold over the asking price in June 2024. While a higher share of homes sold over the asking price in June during the pandemic, this year’s rate remains above the 23% average seen between 2015 and 2019, prior to the pandemic. The elevated share of homes selling over the asking price is consistent with strong homebuyer demand in markets where inventories of homes for sale are lacking and home prices continue to push higher.
- Spring home price appreciation continued to slow amid high mortgage rates and low affordability. Home prices were up about 0.6% in May from April. High mortgage rates this spring led to more markets experiencing cooling prices. In May, among the 100 largest metros, 16 metros saw prices decline from the month before, with El Paso, Texas; Gary, Indiana; Buffalo, New York; and Syracuse, New York leading in the top 5 spots.
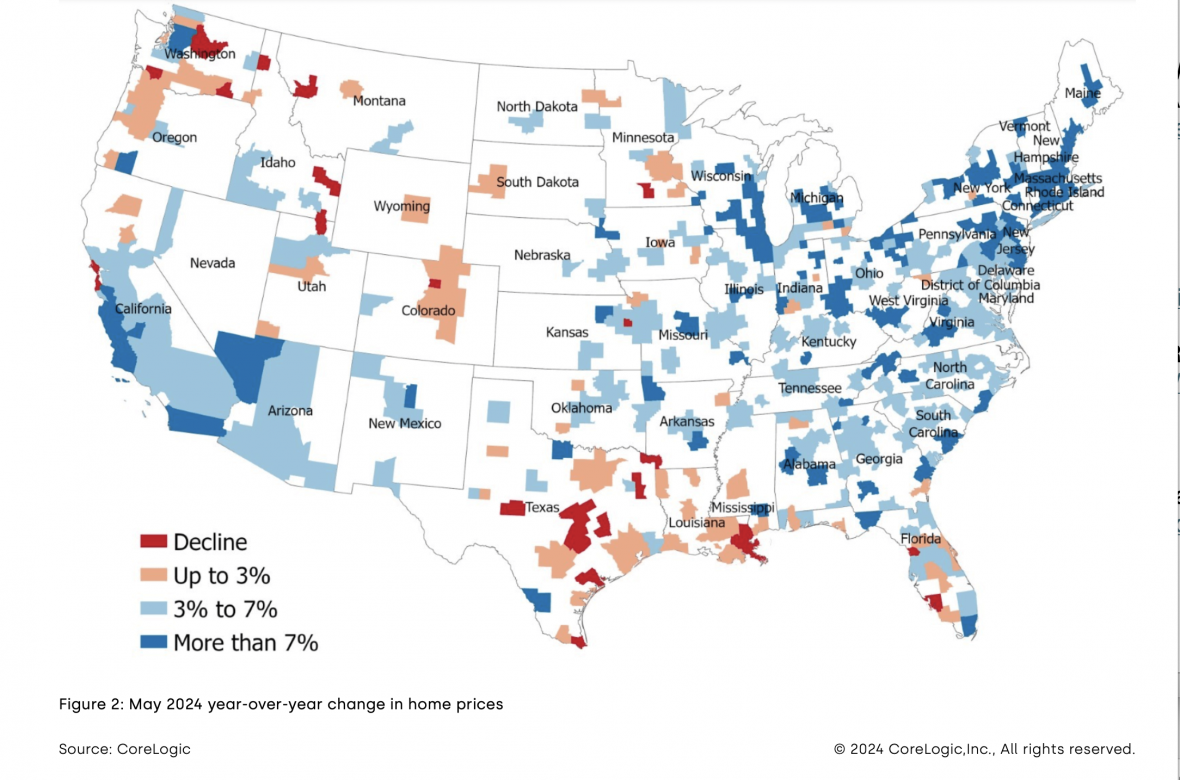
- Annual home price appreciation is also slowing in more markets. Annual U.S. home price appreciation was 4.9% in May. Among the top 100 markets, five metros reported year-over-year declines in May. Austin, Texas led the list with a 3.5% decline. This city was followed by San Francisco, California, down 2.6%; New Orleans, down 0.9%; and the Florida cities of Cape Coral, down 0.6%, and North Port, down 0.2%.
© 2024 Florida Realtors®