
Best Time to Sell Right Around the Corner
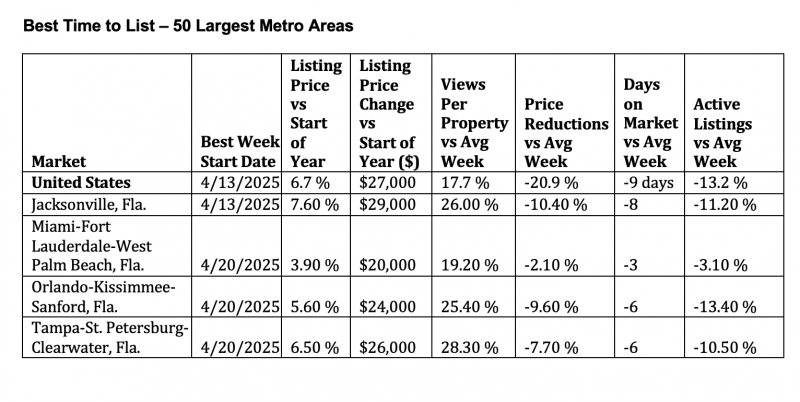
Sellers who list April 13-19 could potentially make $4,800 more, sell their home nine days faster and have 13.2% less competition on average, Realtor.com said.
AUSTIN, Texas — In a challenging real estate market, timing can make a difference and this year, according to the Best Time to Sell report from Realtor.com, the optimal time when sellers are likely to find the ideal balance of market conditions is April 13 - April 19. If 2025 follows the previous years' seasonal trends, sellers who put their home on the market during this week could potentially get an average of $27,000 more on their home sale, sell faster and see more buyers in the market when compared to the start of the year.
"Spring is typically a good time to list your home, and at a time when policy changes and economic turning points create questions and uncertainty, it can be helpful to focus on what we do know," said Danielle Hale, chief economist, Realtor.com. "Very predictably, homes listed in the spring tend to be priced higher and sell faster than the average week throughout the year. While tariffs and inflation continue to be concerns that could dampen buyer and seller confidence, harnessing the seasonal trends in real estate is a proactive way to navigate what's ahead."
Why is April 13-19 the best time to sell in 2025?
As mortgage rates continue to be higher than many buyers and sellers prefer, the market is beginning to show encouraging signs. During the week of April 13, sellers can expect favorable conditions that include inventory, demand, favorable competition and market pace.
- Above average prices – Homes listing during this week historically have a median listing price 1.1% higher than the average week throughout the year and 6.7% higher than the start of the year. If 2025 follows the previous years' seasonal trends, the national median listing price during this week could reach $4,800 above the average week, and $27,000 more than the start of the year.
- Quicker market pace – Thanks to above-average demand, homes generally sell more quickly during this week. Historically, homes actively for sale during this week sold roughly nine days faster than the average week. Market pace did not differ greatly from the previous year in 2024, as the opposing forces of low inventory and low buyer demand resulted in little change. If buyer demand picks up more quickly than inventory this spring, market pace could quicken as buyers vie for fewer homes.
- Above-average buyer demand – The number of buyers browsing a listing can determine how many offers a home gets and how quickly it sells. The more buyers looking at a home, the better for the seller, and in most years buyers start earlier than sellers. Historically, this week has garnered 17.7% more views per listing than the typical week. Mortgage rates have remained higher than 6% for more than two years, and in response, many buyers have stayed out of the market. After two years of high rates, however, it is likely that buyers will trickle into the market this spring, enticed by improved inventory and slowing price growth across much of the country. If mortgage rates also fall this spring, it is possible that demand will surge sooner and with more vigor.
- Lower competition from other sellers – A typical inventory trend would mean 13.2% fewer sellers on the market during this week compared to the average week throughout the year. Seller activity tends to climb from the beginning of the year until roughly November.
Key factors for the 2025 housing market
Heading into 2025's selling season, conditions look a bit rosier with more for-sale options, which can stoke buyer demand in both well-supplied markets and in in-demand markets with low inventory levels. This year's housing market will hinge on improved affordability conditions, which will be highly dependent on falling mortgage rates and climbing inventory.
- Mortgage rates are expected to move to the mid-to-low 6% range by year's end. We do expect mortgage rates to ease this year as inflation gets closer to the 2% target level, but deviations from this trend, as we saw in some of the early year data, will create bumps in mortgage rates and proverbial bumps in the road for homebuyers. While inflation and employment data are key inputs to the Federal Open Market Committee's upcoming rate decisions, policy announcements can move rates, too. Mortgage rates are expected to trend lower. Even so, sellers and buyers would be wise to try to rate-proof their budgets by planning their reactions to a sudden uptick or easing of rates.
- Prices tend to peak later, as does competition. Sellers should consider that peak prices later in the season also come with greater competition from other sellers for a similar-sized pool of buyers. Historically, by the end of June, while prices reached near-peak levels (+7.6% in 2024) compared to the start of the year, new sellers also surged, increasing to nearly 1.5 times higher than at the start of the year (+46.2%). Homeowners hoping to sell this year can mitigate that risk by getting into the market early, raising their odds of a successful close and likely negotiating favorable terms.
- Uncertainty could factor into buyer and seller confidence. Though inflation has eased over the last few months, the path forward is not certain given the current administration's various economic priorities and proposals. Specifically, tariffs could make homebuilding far more expensive in the U.S., and could hurt the housing market both via higher inflation,which keeps mortgage rates high and by limiting homebuilding activity. On the other hand, the administration has signaled their intent to address housing affordability, which could benefit the market. It is too soon to tell how these proposals will play out, and it's important to acknowledge that individual perspectives can influence whether policies create more or less enthusiasm, but buyers and sellers may be hesitant to make any big moves until the future is a bit more clear.
Methodology
Listing metrics (e.g. list prices) from 2018-2019 and 2021-2024 were measured on a weekly basis, with each week compared against a benchmark from the first full week of the year. Due to the onset of the pandemic, 2020 was an uncharacteristic year and has therefore been excluded from the analysis. Averaging across the years yielded the "typical" seasonal trend for each metric. Percentile levels for each week were calculated along each metric (prices, listings, days on market, etc.), and were then averaged together across metrics to determine a Best Time to List score for each week. Rankings for each week were based on these Best Time to List scores.
Source: Realtor.com
© 2025 Florida Realtors®